How Many Pharmacies Are in the USA? AI & Growth Insights
- Remove the current class from the content27_link item as Webflows native current state will automatically be applied.
- To add interactions which automatically expand and collapse sections in the table of contents, select the content27_h-trigger element, add an element trigger, and select Mouse click (tap).
- For the 1st click, select the custom animation Content 27 table of contents [Expand], and for the 2nd click, select the custom animation Content 27 table of contents [Collapse].
- In the Trigger Settings, deselect all checkboxes other than Desktop and above. This disables the interaction on tablet and below to prevent bugs when scrolling.
In a country as vast and diverse as the United States, pharmacies play a critical role in the healthcare landscape. From meeting the daily needs of communities to providing essential medications and services, their presence is vital. As businesses in an ever-changing market, understanding the number and distribution of pharmacies is key to informed decision-making. Whether you're a healthcare entrepreneur, a data analyst, or simply a curious reader, the intricate world of pharmacies offers valuable insights.
“Pharmacy is not just about pills and prescriptions; it's about people and services that cater to every corner of the country.”
This blog aims to guide you through a comprehensive overview of pharmacies across the U.S., shedding light on current trends and leveraging modern technology like AI for site selection and market analysis. Join us as we dive deeply into the numbers, the landscapes, and the strategies that can shape smarter investments and expansions.
How Many Pharmacies Are in the U.S.?
As of the latest data, there are a total of 118,473 pharmacies in the U.S., reflecting a rich and diverse landscape. This vast number highlights the pharmacy sector's critical role in healthcare accessibility and its expansive reach across urban and rural areas. The growing number of community pharmacies indicates their pivotal role in delivering primary care services, such as administering immunizations across various states. Understanding this distribution can guide businesses in making strategic decisions for expansions and pinpointing new market opportunities.
Distribution of U.S Pharmacies by States
From the data provided, it's clear that California leads with the highest number of pharmacies, amounting to 10,591. This aligns with its status as the most populous state in the U.S., suggesting a correlation between population size and the number of pharmacies available.
Texas follows closely with 10,556 pharmacies, reflecting its large geographic area and diverse population needs. New York also shows a significant number, housing 10,236 pharmacies, likely due to its dense metropolitan areas such as New York City.
Interestingly, while Florida ranks fourth with 8,513 pharmacies, it shows a noticeable drop compared to the top three states, which could reflect regional healthcare demand variations or differing state regulations and policies.
Midwestern and Northeastern states like Pennsylvania, Illinois, and Ohio offer a moderate number of pharmacies ranging from 3,982 to 4,907, aligned with their population sizes and possibly regional healthcare networks.
Meanwhile, North Carolina, New Jersey, and Michigan exhibit similar pharmacy counts, highlighting the balance between urban centers and rural areas in these regions. This equitability might indicate stable access to pharmacies, crucial for consistent healthcare service delivery.
Key Data Insights for Gas Stations in the U.S.A
Establishments inside the Pharmacy
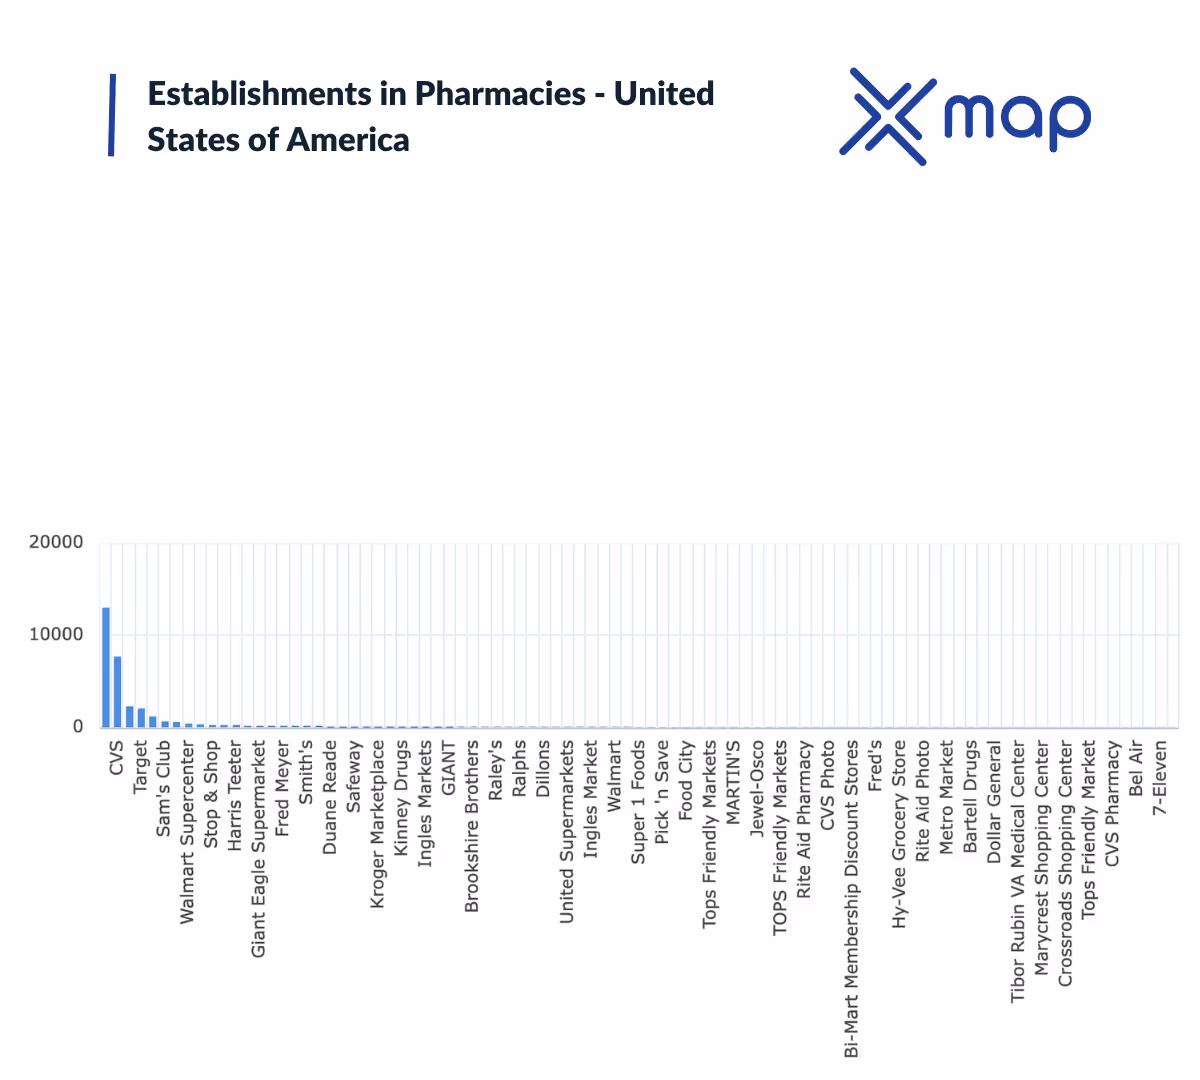
The data clearly outlines the considerable dominance of national retail chains in the U.S. pharmacy landscape. Walgreens, with a remarkable 12,998 stores, is miles ahead in terms of the number of locations, followed closely by CVS which comprises 7,683 units. This suggests a competitive duopoly at the national level, particularly when considering their widespread presence and extensive customer reach.
Rite Aid, the third-largest chain, operates a significantly smaller number—approximately 2,291 locations. This indicates a steep drop-off in scale post the leading two chains, revealing potential areas for market entry or expansion for other players if they can harness unique strategies or regional advantages.
Regional variations are also evident through supermarkets such as Kroger, H-E-B, and Giant Eagle, which have carved out localized pharmacy presences. These numbers signify the leverage of integrating pharmacy services within larger retail ecosystems to cater to community-specific needs.
The data reflects a potential opportunity for growth among smaller chains and independents, as the monopolistic trend suggests a need for niche services or personalized approaches to capture specific market segments that large chains might overlook.
Overall, the complex interplay of chain dominance and regional specialization underscores the continual evolution of the pharmacy sector, urging businesses to frequently analyze these dynamics for strategic positioning.
Ratings Data
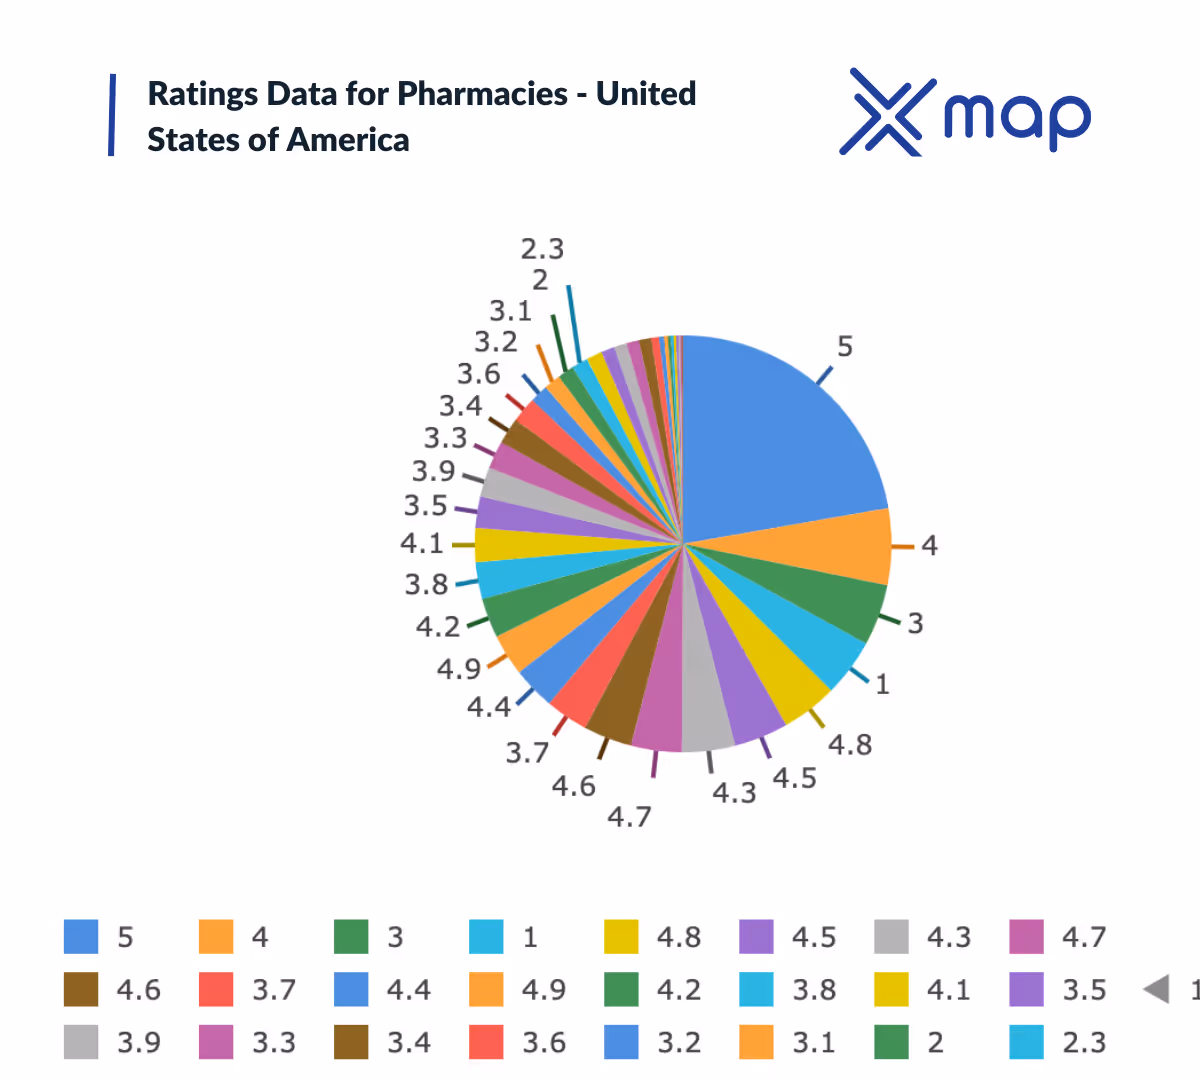
- The majority of pharmacies have commendable ratings, with 9,313 receiving a perfect score of 5, indicating a strong consumer satisfaction level across many U.S. pharmacies.
- There is a notable concentration of pharmacies with ratings within the 4 to 5 range, suggesting high competition in maintaining service quality to remain highly rated.
- Interestingly, a sharp drop is observed as ratings fall below 3, with only 1,874 pharmacies rated as 1, signifying that poorly rated pharmacies are less common.
- The data reveals that pharmacies rated between 4.0 and 4.9 comprise a significant portion, reflecting consumer satisfaction with service quality and potentially viable options for investments or partnerships.
- Businesses could focus strategies on outperforming in service delivery to shift through the densely populated mid to high rating range (3.5 to 4.5), capitalizing on incremental quality improvements for competitive advantage.
Number of Reviews
- The average number of reviews per pharmacy generally hovers around 94, indicating a significant engagement level from customers.
- Most pharmacies fall within the range of having 14 to 19 reviews, which implies variability in customer feedback across different locations.
- Interestingly, a few pharmacies have notably high review counts, such as those with 107, 106, and 105, suggesting a possible correlation with either pharmacy popularity or contentious service that prompts more frequent reviewing.
- Pharmacies with lower review counts, such as those with 14, indicate an opportunity for these establishments to encourage more customers to provide feedback, which could enhance their online presence and reputation management.
- The distribution of review numbers suggests that while some pharmacies receive more public engagement, there is a relatively consistent pattern that many pharmacies experience moderate levels of customer interaction.
Price Ranges
- The majority of pharmacies fall within the "Moderately expensive" price range, accounting for 11,745. This indicates a significant concentration of pharmacies catering to this pricing tier, suggesting a competitive market environment for moderately priced pharmaceutical offerings.
- In contrast, the "Inexpensive" category comprises only 985 pharmacies. This disparity highlights a potential gap in the market for budget-conscious consumers, presenting an opportunity for businesses to explore entry or expansion into this segment.
Phone Numbers
Having access to phone numbers for 114,630 out of the 118,473 pharmacies in the U.S. presents a significant asset for businesses and consumers alike. This prevalence of contact information enhances customer service potential, allowing for direct communication with pharmacies to check inventory, seek advice, or confirm business hours. Furthermore, businesses looking to form partnerships or expand their operations can leverage this data to facilitate smoother interactions and negotiations with existing pharmacies. By analyzing which pharmacies maintain readily available contact details, companies can also deduce the operational standards and potentially prioritize relationships with those offering easier access. Overall, this widespread availability plays a crucial role in enhancing the overall efficiency and accessibility of the pharmaceutical industry landscape.
Services
- Drive-through services are the most widely offered, available in 2,355 pharmacies, reflecting strong consumer demand for quick and convenient service.
- In-store shopping combined with kerbside pickup is offered by 1,944 pharmacies, demonstrating a significant trend towards contactless purchasing while still allowing for personal selection.
- In-store pick-up stands alone as a service in 1,031 pharmacies; this suggests it remains a popular choice for consumers who prefer to ensure their items are ready before entering the store.
- Delivery services are provided by 877 pharmacies, highlighting the increasing importance of home delivery, especially due to the rising influence of e-commerce.
- Combinations of in-store pick-up and delivery are less common, offered in only 54 pharmacies, which may signify challenges or additional costs associated with maintaining dual service modes.
- Fewer pharmacies offer kerbside pickup and delivery together (48 pharmacies), potentially indicating a niche market or geographic-specific demand for this service pair.
- Only a small number of pharmacies (20) provide delivery alongside in-store shopping, suggesting limited integration of these services, possibly due to logistical constraints.
- Services such as 'Dine-in' with options like kerbside pickup and delivery appear in just one pharmacy, suggesting that such unique combinations are highly specialized and rare within the industry.
Benefits of Geospatial Data in Pharmacy Site Selection
Geospatial data provides a competitive edge to pharmacy operators by illuminating crucial factors that drive successful site selection. It involves the analysis of geographic information to understand patterns, trends, and relationships within a specific area. For pharmacy businesses, strategic use of this data can lead to optimal location choices that maximize customer accessibility and business growth.
Identifying Optimal Locations
Using geospatial data, pharmacies can pinpoint high-demand areas that may be underserved. By analyzing population density, demographic information, and healthcare needs, businesses can identify gaps in the market. For example, nonmetropolitan areas, where community pharmacies are often vital, can be targeted effectively. According to the Bureau of Labor Statistics, these areas have a significant concentration of pharmacist jobs and opportunities (source).
Competitor Analysis
Geospatial data allows pharmacies to map and evaluate the competitive landscape. It provides insights into the proximity of competitor locations and their service offerings. This information is crucial for determining a niche market or for establishing partnerships with local healthcare providers. Furthermore, 92% of pharmacies operate primarily as retail establishments (source), indicating the importance of analyzing retail dynamics in site selection.
Understanding Customer Behavior
Through customer behavior analysis, pharmacies can tailor services to meet the community's needs. Geospatial data reveals information about foot traffic patterns, peak hours, and customer preferences. This data enables pharmacies to adapt their business model, ensuring services align with customer expectations. A comprehensive understanding of patient interaction within community pharmacies, as reported by various studies, suggests that community-focused strategies can enhance patient care and engagement.
Geospatial Data InsightPotential BenefitPopulation Density AnalysisIdentifies high-demand areasCompetitor MappingTargets niche markets and partnership potentialCustomer Traffic PatternsOptimizes service offerings and operation hours
Best Practices for Leveraging Pharmacies Geospatial Insights
When using geospatial data, it's vital to harness its potential to optimize pharmacy locations and enhance customer satisfaction. Here are some best practices to ensure your approach is both effective and strategic:
- Utilize AI Tools: Leverage advanced AI analytics to sift through large volumes of geospatial data. AI can help identify patterns and predict potential pharmacy success based on location demographics, traffic patterns, and nearby facilities.
- Conduct Comprehensive Market Analysis: Before setting up a new pharmacy, assess the local competition. Understand where competitors are situated, what services they offer, and any gaps you can fill to benefit the community.
- Focus on Accessibility and Convenience: Consider the ease with which potential customers can access your pharmacy, whether they’re walking, driving, or using public transport. Accessibility can dramatically impact foot traffic and customer loyalty.
- Integrate Patient and Community Needs: By understanding local health trends and community requirements, tailor your pharmacy services to fulfill these needs, thus building trust and reliability with your customer base.
- Monitor Technological Advancements: Stay up-to-date with the latest in geospatial tools and technologies. This includes investing in software that provides real-time location data and predictive insights for more responsive decision-making.
Incorporating these best practices into your strategic planning can significantly improve your pharmacy’s performance, ensuring that you’re not just meeting present demands but are also well-prepared for future opportunities.
Conclusion
In summary, the U.S. pharmacy landscape is dynamic, shaped by varying geographic distributions and competitive forces that impact strategic decisions in the pharmaceutical industry. Leveraging this comprehensive data about pharmacies, businesses can identify optimal locations, analyze competitors, and understand customer behavior, potentially unlocking new avenues for growth and success.
How xMap Polygon AI help pharmacies?
- Accurate Predictive Analysis: Generative AI in xMap Polygon AI can analyze vast datasets to forecast potential market trends and customer behaviors, aiding pharmacies in crafting effective business strategies.
- Enhanced Data Visualization: Converts complex geospatial data into understandable visuals, helping pharmacies easily identify patterns and insights crucial for decision-making.
- Streamlined Inventory Management: Predicts pharmaceutical demand trends to ensure optimal stock levels, reducing losses from overstock or understock situations.
- Personalized Marketing Strategies: Leverages customer data to tailor marketing campaigns, thereby increasing engagement and reaching the right audience more effectively.
- Competitive Intelligence: Provides insights into competitor locations and strategies, enabling pharmacies to position themselves advantageously in the market.
- Site Selection Precision: Assesses potential locations for new outlets, considering demographic data and competition, increasing the chances of successful expansion.
Subscribe for advanced Data analysis Tips and Reports

Get in Touch
Whatever your goal or project size, we will handle it.
We will ensure you 100% satisfication.
"We focus on delivering quality data tailored to businesses needs from all around the world. Whether you are a restaurant, a hotel, or even a gym, you can empower your operations' decisions with geo-data.”

