Red Lobster's U.S. Locations: Growth and AI Opportunities
- Remove the current class from the content27_link item as Webflows native current state will automatically be applied.
- To add interactions which automatically expand and collapse sections in the table of contents, select the content27_h-trigger element, add an element trigger, and select Mouse click (tap).
- For the 1st click, select the custom animation Content 27 table of contents [Expand], and for the 2nd click, select the custom animation Content 27 table of contents [Collapse].
- In the Trigger Settings, deselect all checkboxes other than Desktop and above. This disables the interaction on tablet and below to prevent bugs when scrolling.
Imagine a dining landscape dotted with Red Lobster restaurants, each one offering its signature seafood delicacies to communities across the U.S. Whether you are a seafood lover or an investor seeking opportunity in casual dining, understanding this iconic chain's market footprint is essential. What if you knew how many Red Lobsters populate the nation or which states have the most? These are not just trivia; they are insights into the brand's business pulse.
"Knowing where you are is just as important as knowing where you want to go." — Anonymous
In this analysis, we'll unravel the numbers behind Red Lobster’s presence, dig into geospatial data to reveal patterns, and highlight key business strategies that fuel its growth. Additionally, we’ll explore how this data can equip you with strategic foresight to drive your decisions, whether you're scouting for new locations or investing in the brand. Stay with us as we chart this informative course through Red Lobster's positioning in the dining landscape, using advanced AI tools to spot untapped opportunities.
How many Red Lobster's are in the United States?
With 632 Red Lobster restaurants in the United States, it’s clear that this seafood sensation has achieved significant national coverage. This widespread presence positions Red Lobster as one of the leading players in the casual dining sector. Not only does this number reflect the brand's popularity, but it also speaks to its strategic placement in areas that capture diverse markets. By having a strong foothold across the country, Red Lobster can maintain a robust operational scale, allowing for competitive pricing and menu innovation that caters to a variety of regional tastes and preferences.
Distribution of Red Lobster's in United States by States
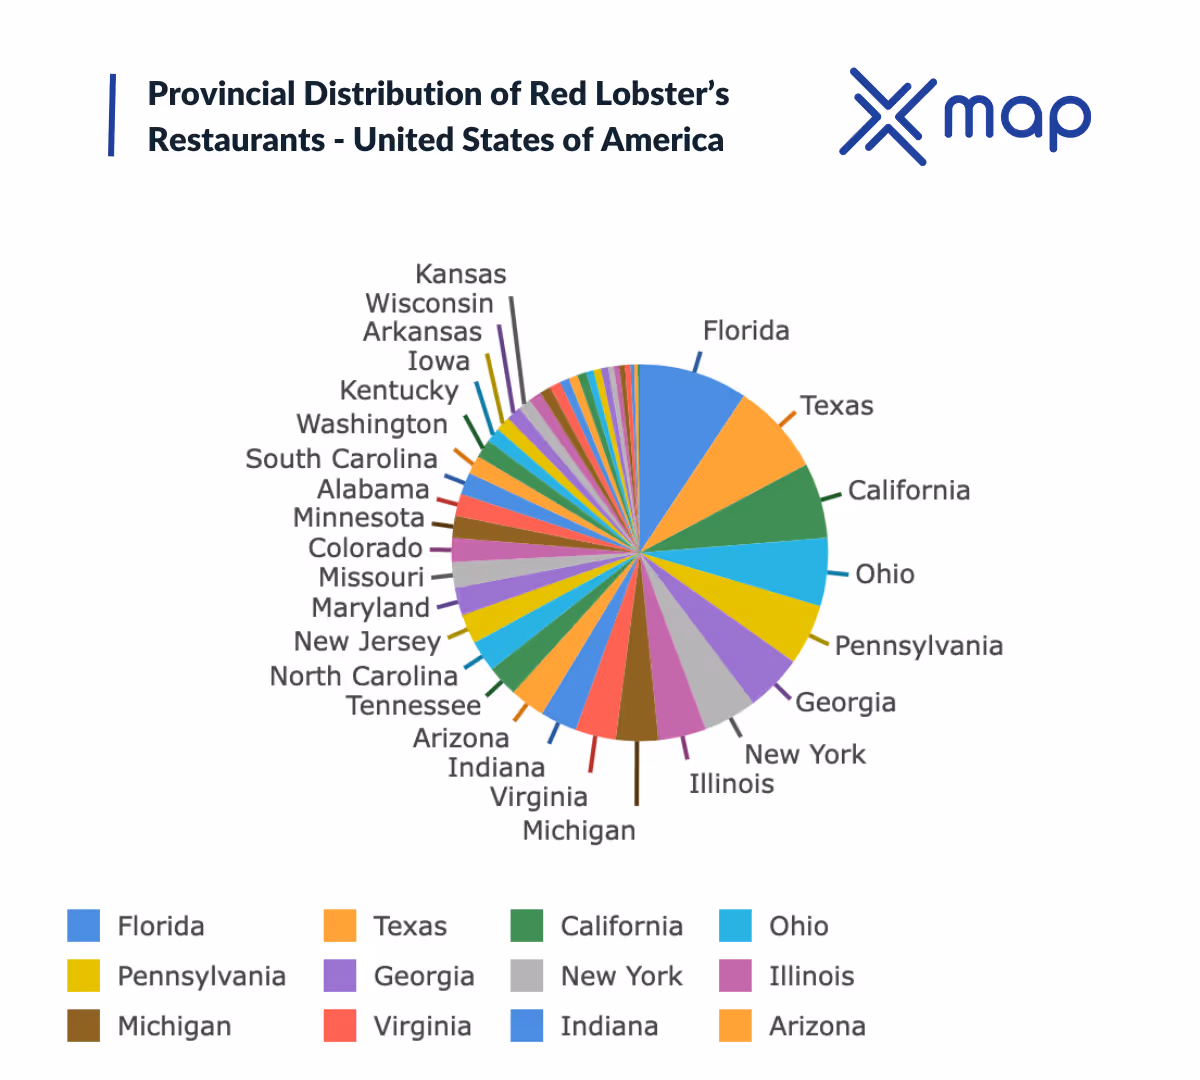
- Florida boasts the highest number of Red Lobster locations, indicating a strong market presence in this state.
- The significant number of stores in Texas suggests an equally robust market, crucial for regional strategies.
- California, known for its diverse culinary landscape, still provides ample opportunities with its sizable store count.
- States like Ohio and Pennsylvania show consistent market coverage, making them reliable areas for business operations.
- With 29 locations, New York presents a focused northeastern strategy for Red Lobster.
- Illinois and Georgia indicate expansion viability within the Midwest and southern locales.
- Virginia and Michigan reflect balanced distribution across different regions, ensuring broad consumer reach.
- The distribution strategy favors populous states, aligning with consumption potential and economic scale.
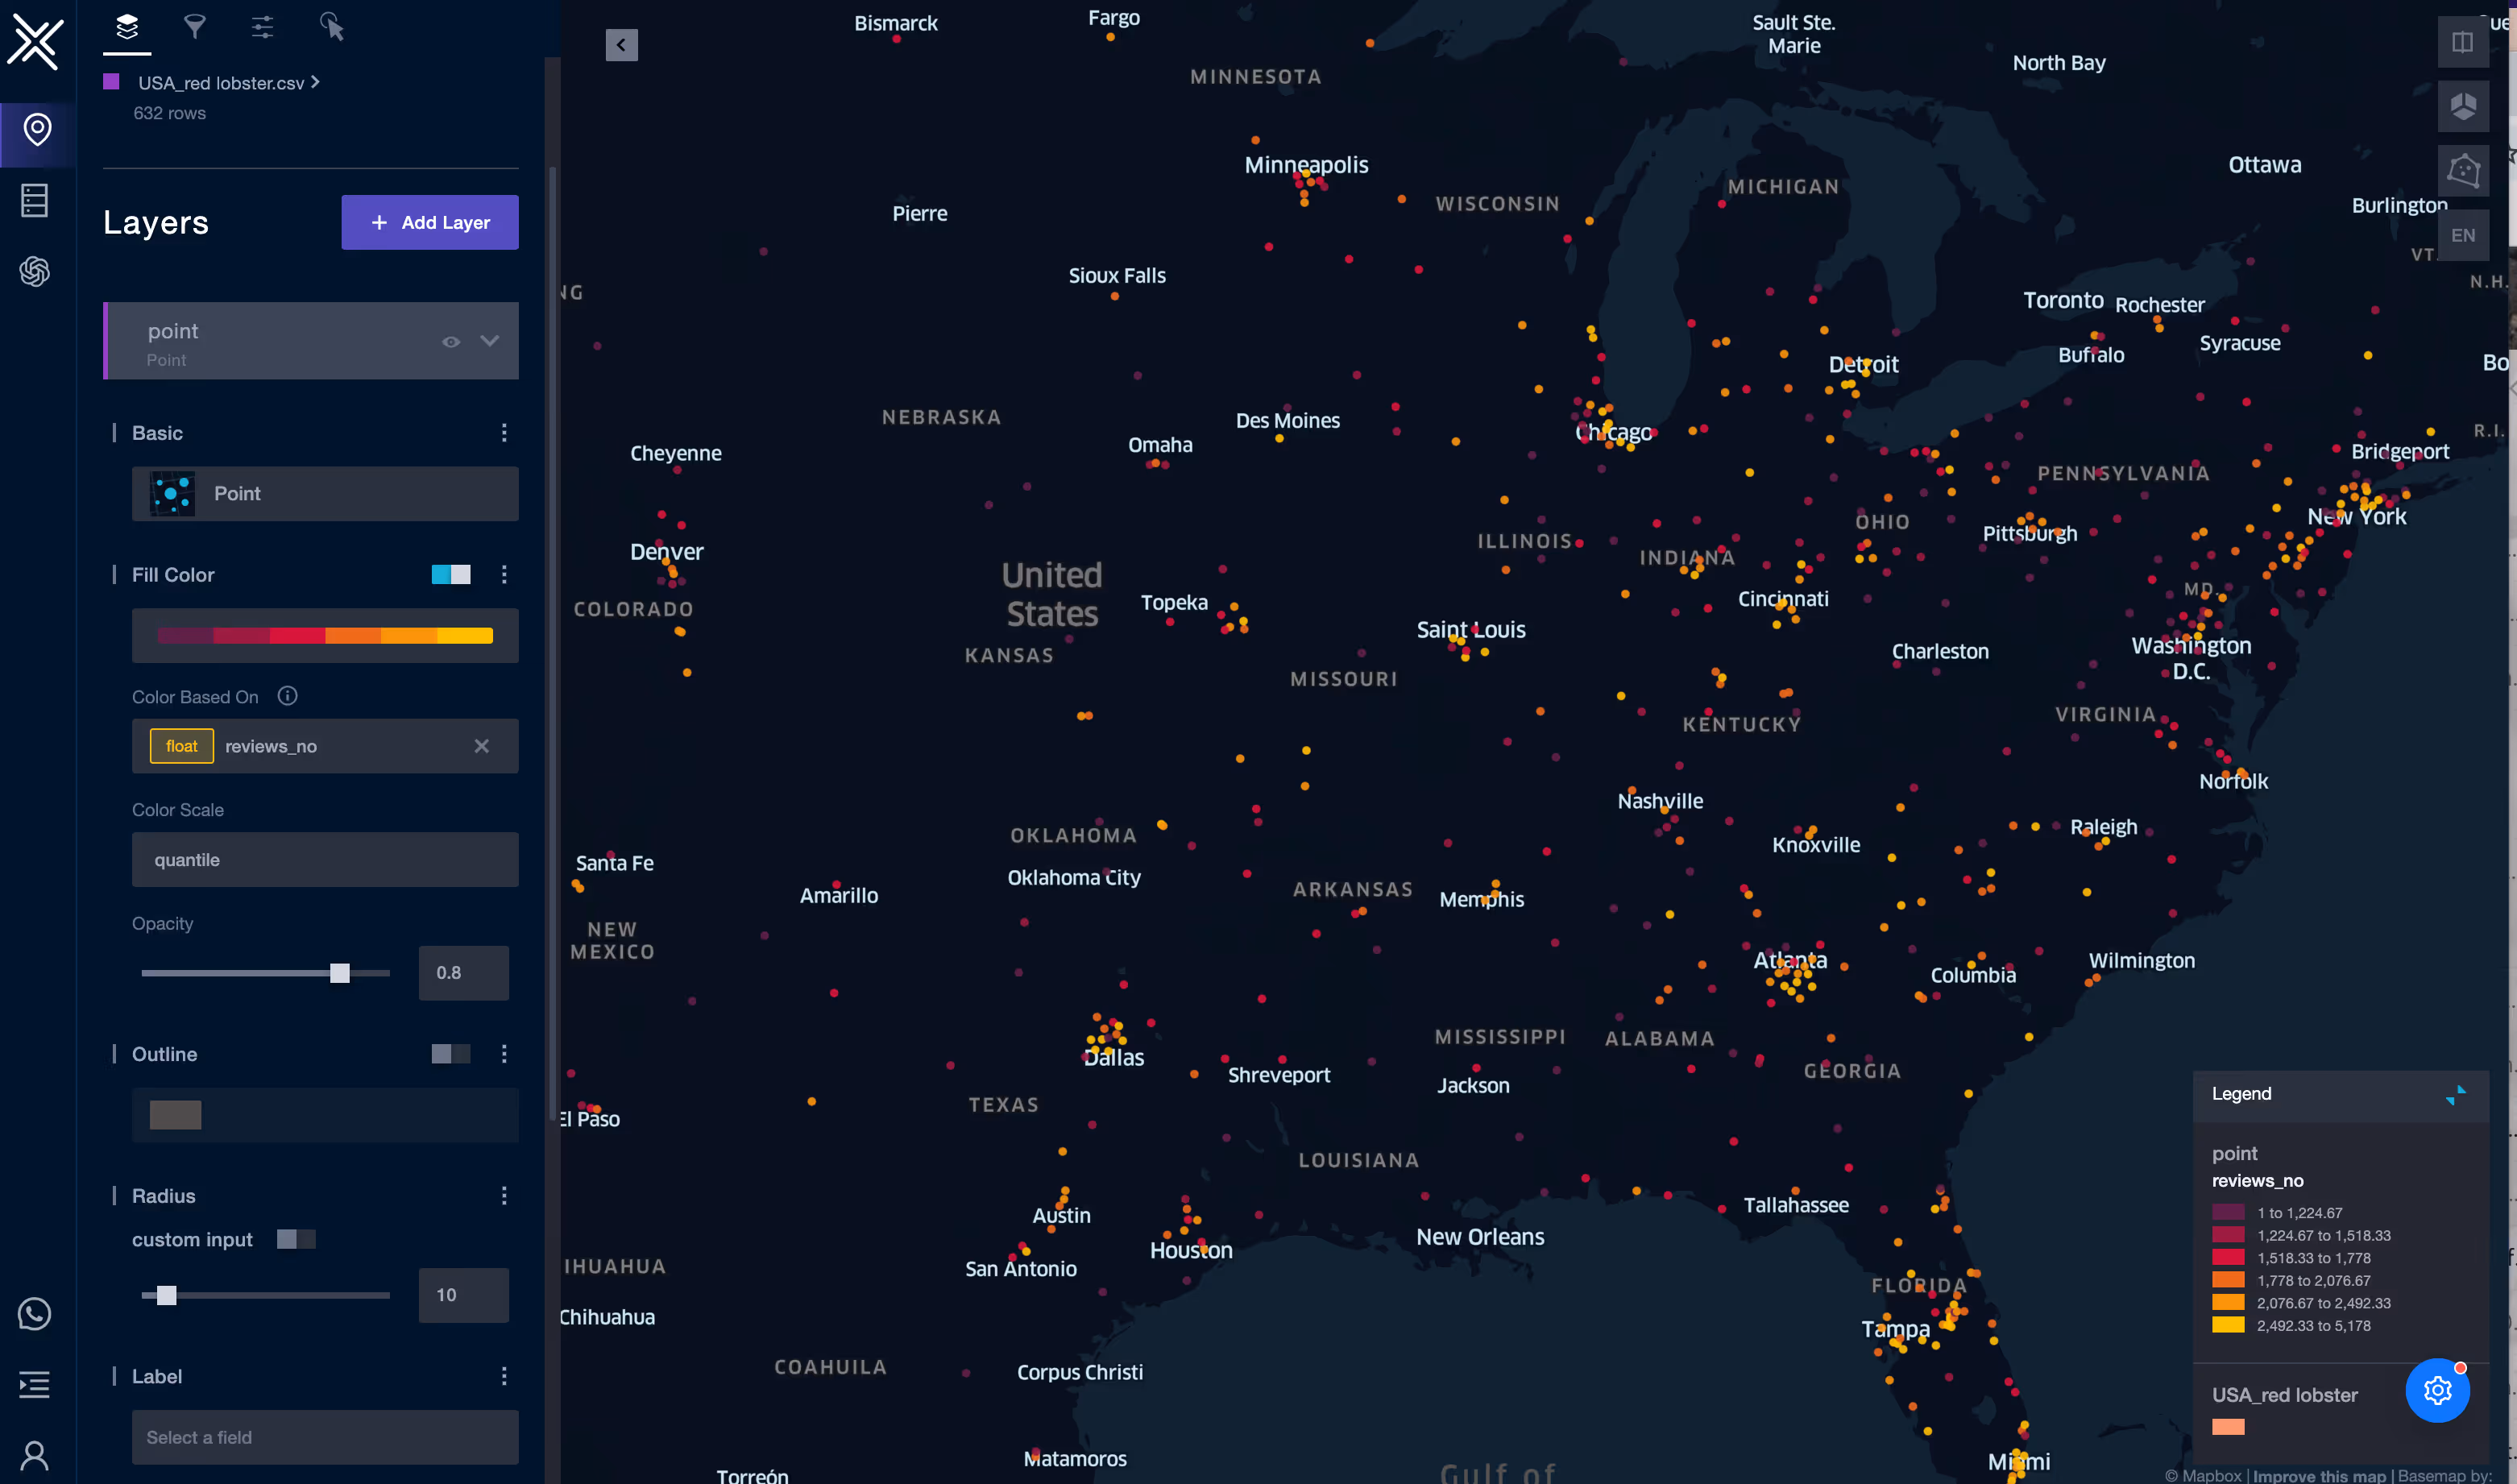
Decoding Geospatial Data for United States Red Lobster's restaurants
Understanding the distribution of Red Lobster locations involves analyzing geospatial data that provides insights into consumer behavior, market trends, and potential growth areas. One of the key components of geospatial analysis is mapping out the locations using latitude and longitude coordinates. This data not only plots the existing restaurants but also helps identify clusters and gaps in market presence.
Traffic Data
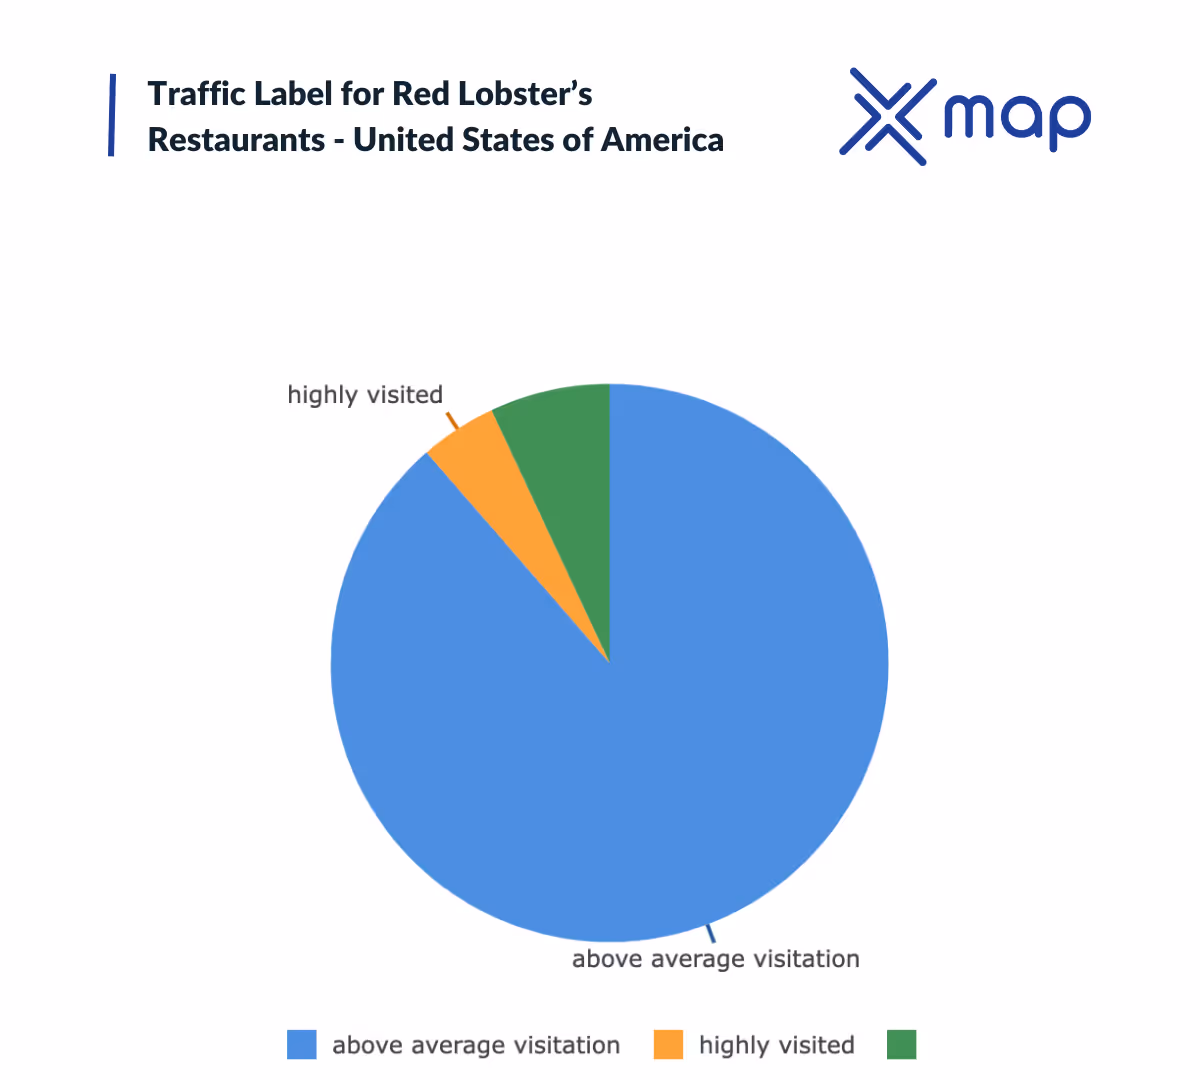
Analyzing the data, it's clear that the majority of Red Lobster locations enjoy above-average visitation, with 560 out of 568 locations reporting this level of foot traffic. This suggests a strong presence and customer draw at most sites. Additionally, 28 locations are characterized by high visitation, potentially indicating prime locations such as those near major attractions or within bustling urban centers. These insights could guide future site selection and marketing strategies, ensuring new locations are positioned for optimal success.
Interestingly, there is no data available for 44 locations. This could be an opportunity to explore why data might be missing—perhaps due to recent openings or changes in location metrics—and take steps to ensure comprehensive data collection in the future.
Price Range
When examining Red Lobster's pricing strategy, it’s evident that the majority of their U.S. locations, precisely 627 outlets, fall within the "$$" price range. This suggests that Red Lobster is strategically positioned as an affordable seafood dining option, appealing to a broad segment of diners who seek quality meals at reasonable prices. It’s noteworthy that a handful of locations, only five to be exact, do not have available pricing data. This could indicate newer restaurants, ongoing menu adjustments, or pending updates within their pricing systems.
Number of Reviews
- It appears that locations with a higher number of reviews typically have at least two or more branches. This pattern suggests popularity often correlates with having multiple locations in a given area, potentially due to increased visibility and access.
- In cases where there are fewer locations but a higher number of reviews, such as those with only one or two branches, it might indicate a loyal customer base or significant local interest despite limited geographic coverage. This could present an opportunity for expansion.
- Restaurants with higher review counts could be prioritized for further analysis to identify successful factors affecting customer satisfaction and engagement, which might be replicable in new areas.
- Clusters of high review counts at locations with fewer than 3 branches might reflect saturation points in particular markets, or indicate high demand clusters that could support additional outlets.
- Strategically leveraging high review counts in site selection could optimize future expansion efforts—by focusing on areas with demonstrated customer interaction and interest, businesses may capitalize on existing momentum.
How investor can use these above geospatial analysis for expanding Red Lobster's locations?
Investing in expanding Red Lobster's locations involves a multifaceted approach. By leveraging geospatial analysis, investors can make strategic decisions that align with current trends and growth potential in the food and beverage industry. Let's delve into how you can utilize these insights effectively.
Identify High-Traffic Areas
A crucial first step is identifying areas with high foot traffic. By analyzing geospatial data, you can pinpoint where potential customers congregate, such as shopping centers, tourism hotspots, and business districts. According to a recent study, locations near shopping centers can boost restaurant footfall by 30% compared to isolated areas.
Evaluate Competitor Clusters
Understanding where competitors are clustered is equally essential. This doesn't only mean avoiding saturated areas but also tapping into regions where competitors may have paved the way for seafood dining demand. For example, if an area hosts several casual dining options but lacks a seafood specialty, it represents a prime opportunity for Red Lobster.
Utilize Demographic Data
Utilize demographic data to identify target audiences that align with Red Lobster’s offerings. Consider the median income, age group, and dining preferences of potential neighborhoods. According to data from Demographic Report 2023, areas with a median household income above $75,000 saw a higher than average spend on dining out, indicating a lucrative target market.
Analyze Existing Location Performance
Reviewing the performance of existing Red Lobster locations can provide insights into successful areas. Utilize metrics such as average check size, review sentiments, and repeat customer rates. Here’s a simple example in table form:
LocationAverage Check SizeCustomer ReviewsBoston, MA$40PositiveMiami, FL$35MixedDallas, TX$45Very Positive
Predicting Future Trends
Finally, forecasting future growth trends using geospatial analysis is key. By tapping into AI tools and machine learning, investors can predict underserved regions ripe for a new Red Lobster location. These insights can be further supported by socioeconomic changes, such as new housing developments or emerging business parks, which often indicate a growing population base.
Conclusion
Red Lobster's extensive presence across the United States underscores the importance of strategic geographic distribution and data-driven decision-making in the restaurant industry. By understanding store count, distribution, and utilizing geospatial data, businesses can identify prime locations, evaluate competition, and make informed investment decisions. As industry trends continue to evolve, tools like AI offer invaluable insights into uncovering growth opportunities in underserved areas.
Leveraging Polygon AI for F&B Businesses in United States
- Enhanced Market Analysis: Generative AI, powered by XMap Polygon AI, equips businesses with advanced tools to analyze market data. This insight helps identify potential areas for expansion by evaluating demographic trends and consumer behavior.
- Improved Site Selection: By leveraging sophisticated algorithms, businesses can pinpoint optimal locations for new sites. This approach minimizes risks and maximizes the potential for success by focusing on areas with high foot traffic and strong consumer interest.
- Competition Insight: Understand competitor locations and market saturation. AI insights help map out these dynamics, allowing businesses to make strategic decisions on where to open new outlets or which markets to target.
- Real-Time Data Processing: Harness the power of real-time data analysis to keep track of changing market conditions, ensuring quick adaptability and strategic agility in business operations.
- Predictive Modeling: Utilizing AI for predictive insights aids in forecasting future trends, essential for long-term strategic planning and identifying emerging opportunities in underserved markets.
- Customizable Solutions: XMap Polygon AI offers personalized analytics solutions, catering to specific business needs and enabling tailored strategies focused on unique geographic and market conditions.
Subscribe for advanced Data analysis Tips and Reports

Get in Touch
Whatever your goal or project size, we will handle it.
We will ensure you 100% satisfication.
"We focus on delivering quality data tailored to businesses needs from all around the world. Whether you are a restaurant, a hotel, or even a gym, you can empower your operations' decisions with geo-data.”

