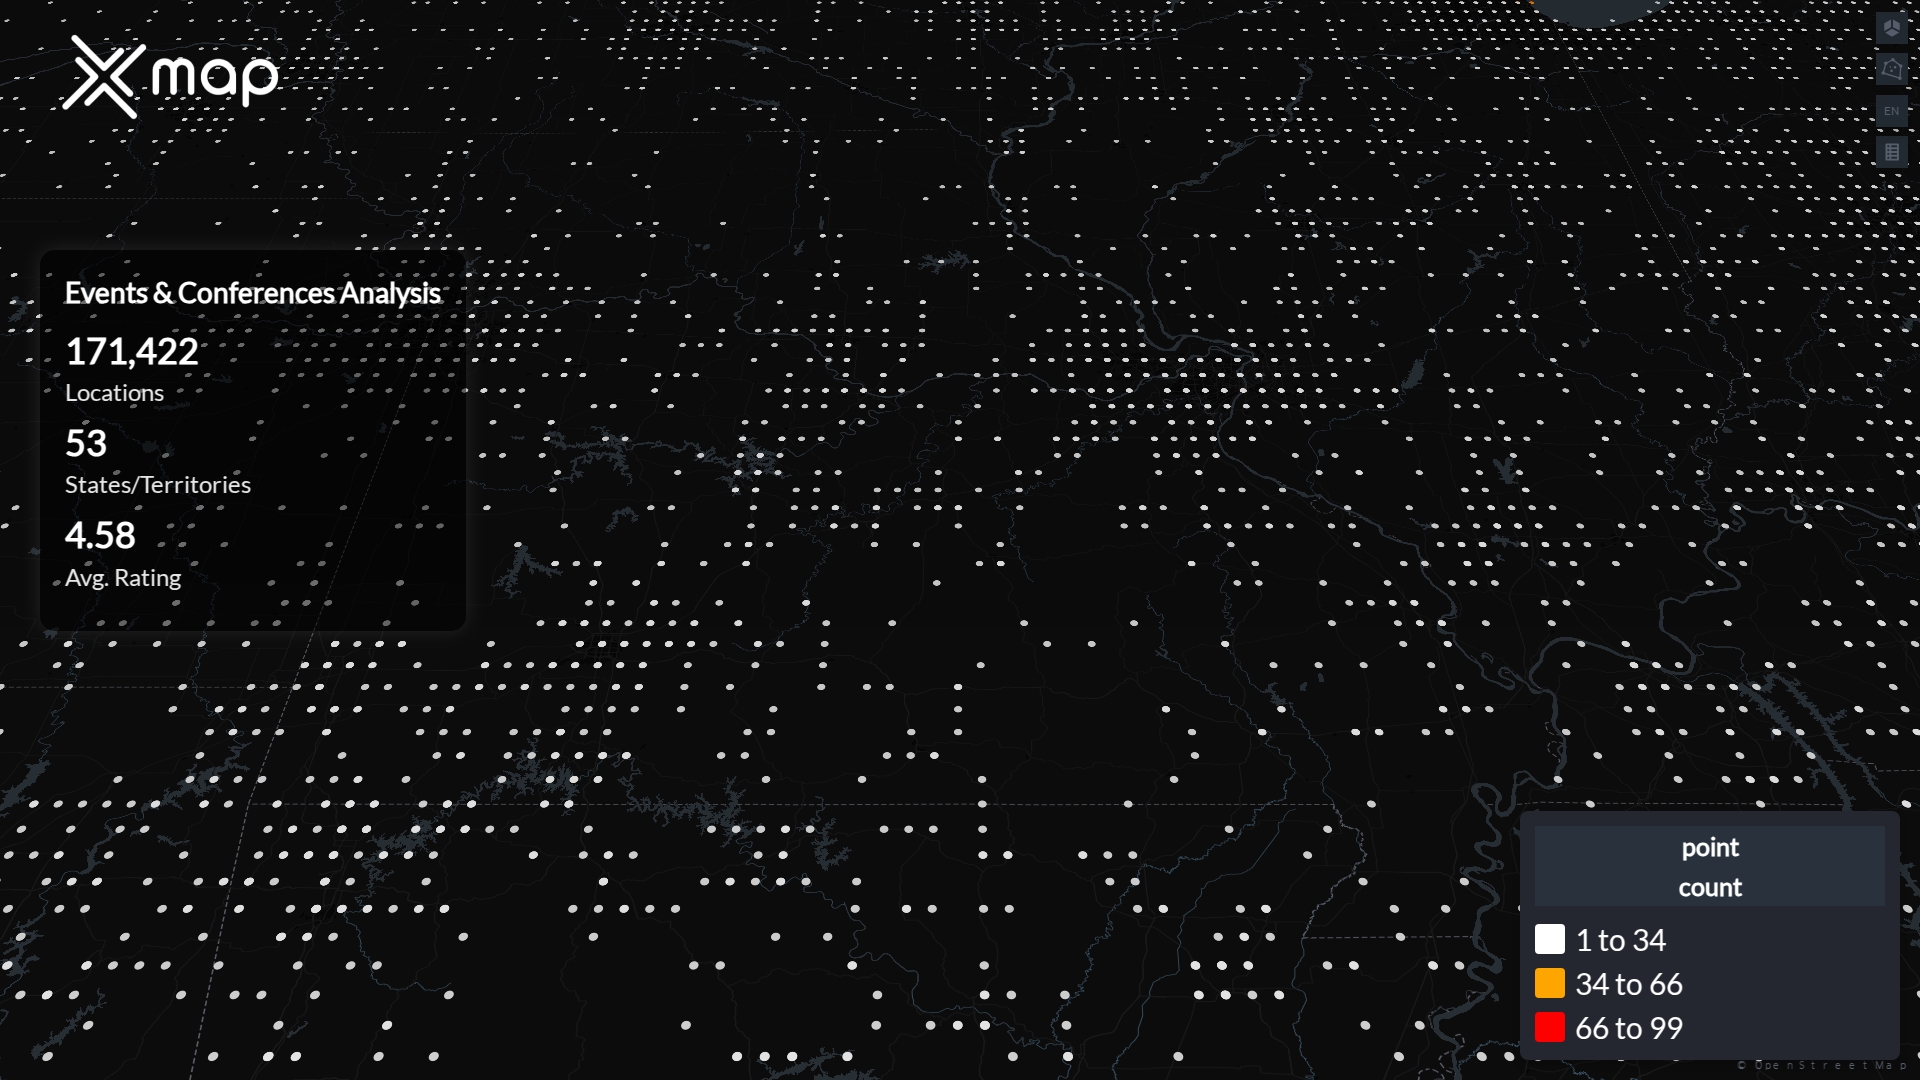
Events & Conferences Locations in United States
With over 171,422+ Events & Conferences locations across 53 regions and 1736 districts in United States. The highest number of Events & Conferences locations are in California and Los Angeles with 20022 locations and 6649 locations, respectively. Find the best places for Events & conferences with our updated database.

How Many Events & Conferences Establishments are in United States?

171422

110286

145395

104444

28919
Breakdown of Events & Conferences Locations in United states
Events & conferences Locations by State in United States
Top Cities for Events & conferences in United states
Download a Sample Dataset for Events & conferences Locations in United states.
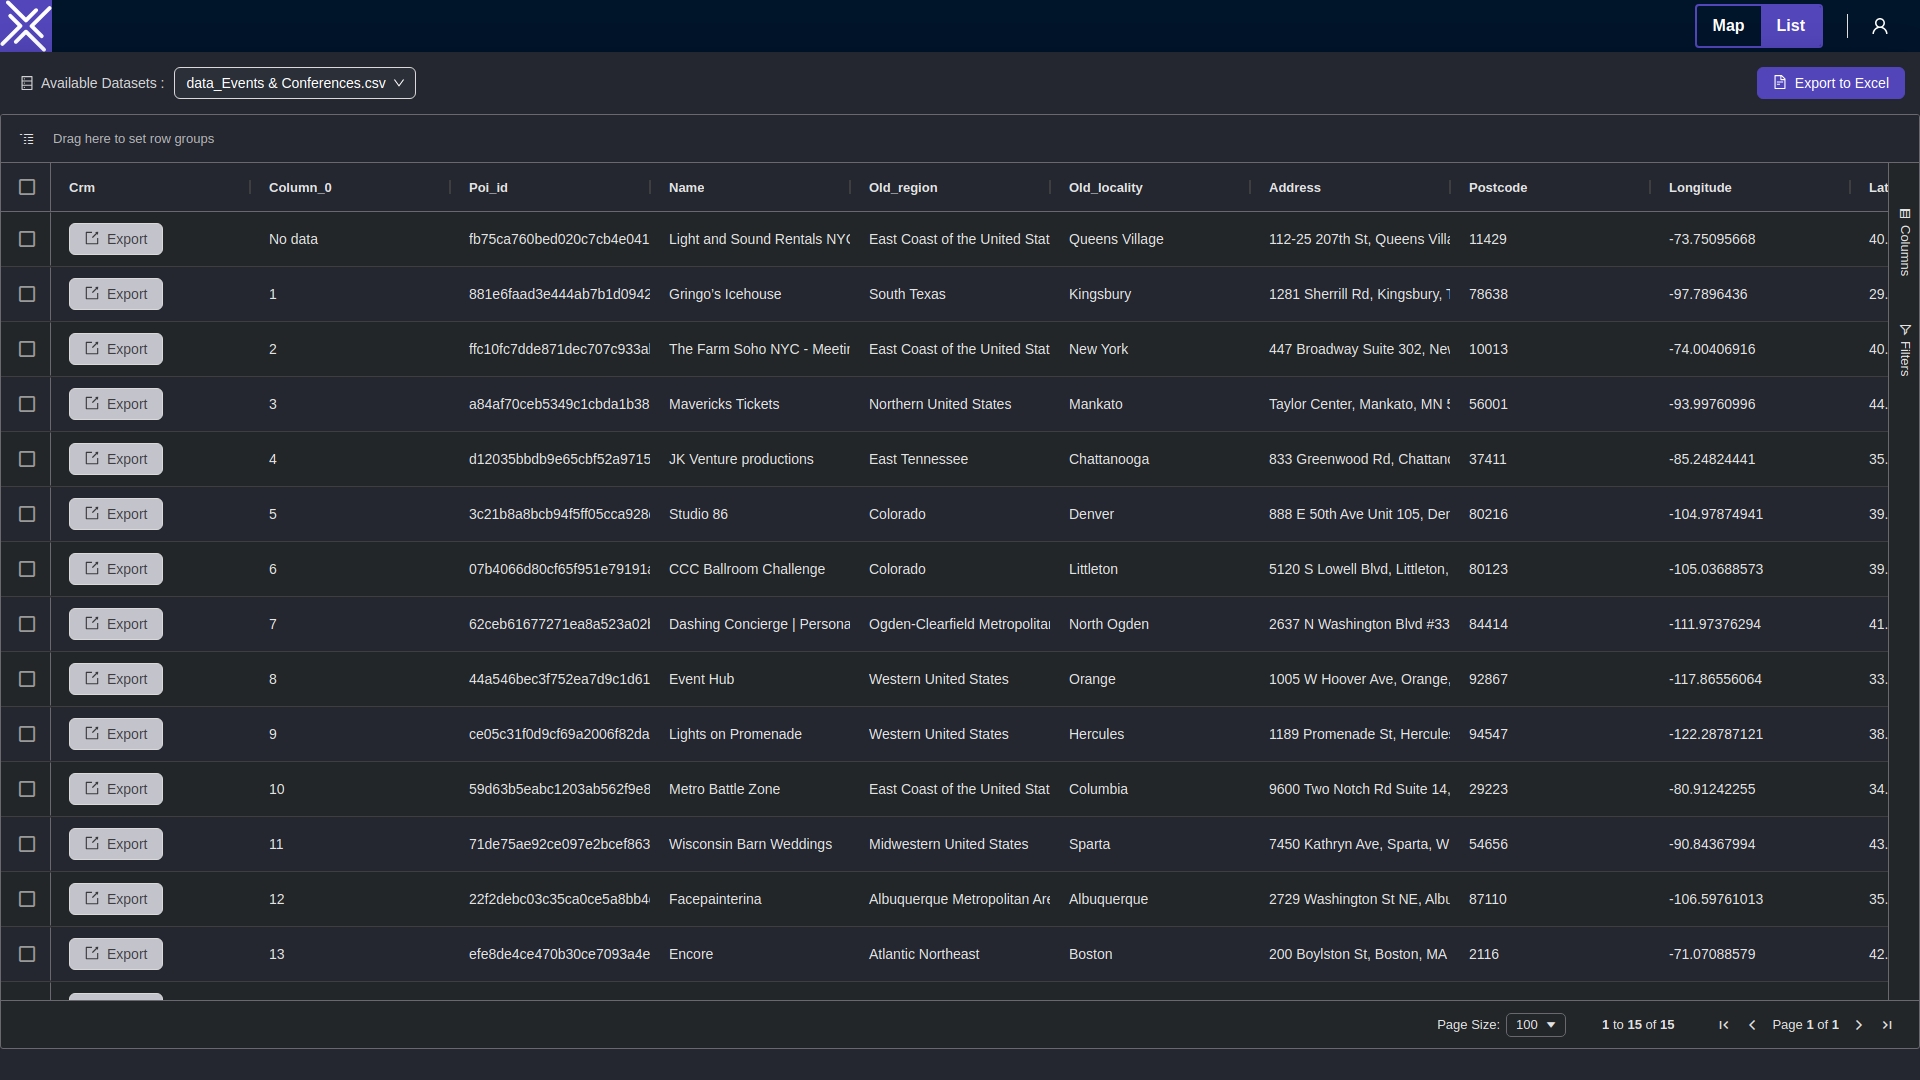
Key Variables for Events & Conferences Dataset in United States
Business Closure Insights for Events & Conferences in United States
Traffic Insights for Events & Conferences Locations in United States
Customer Ratings for Events & Conferences Locations in United States
Business Contact Information by States for Events & Conferences dataset in United States
Why Businesses Trust xMap's Dining & Drinking Locations Dataset for United States?
Businesses rely on xMap's dataset because it provides:
- Comprehensive Coverage – Over 1,423,512 verified Dining & Drinking locations across United States.
- Real-Time Insights – Updated business status, ratings, traffic scores, and consumer trends.
- High Data Accuracy – Curated from reliable sources with precise geolocation details.
- Business-Friendly Format – Easy-to-use data for market analysis, site selection, and competitor research.
- Proven Value – Trusted by retailers, real estate developers, and urban planners for strategic decision-making.
Use Cases
How can this dataset benefit you?
Businesses can identify high-traffic locations to expand their operations in United States based on footfall trends and business status.
Analyze top-rated establishments, brand distribution, and category trends to understand market dynamics and customer preferences.
City planners and real estate developers can use traffic data and closure rates to assess demand and optimize zoning for commercial spaces.
Get Access to United states's Events & conferences Data Today!
Frequently Asked Questions
Find answers to commonly asked questions about our globally available geospatial data.
Each dataset includes core attributes like name, address, phone number, business status, website, time spent, category, sub-category, coordinates, rating, contact info, and more. You can request a sample file to review all columns before purchasing.
We aggregate and validate data from a mix of public sources, partner APIs, web crawlers, and proprietary models to ensure maximum accuracy and freshness. You can learn all about xMap's Data Sourcing model in this document.
Yes, we offer custom pricing for bulk purchases, recurring data needs, or multi-category deals. Contact us at solutions@xmap.ai or schedule a call.
You can buy directly through the Data Shop, or request a formal quotation for procurement via email. We also support custom invoicing and purchase orders on request.
Each main category includes dozens of subcategories. You'll find a breakdown of all covered subcategories on the page under the "Breakdown of XX Location in YY country" section.
Yes, you can request a sample or reach out with your required keywords—we'll confirm if they're included in the dataset before you buy.
Absolutely. If you'd prefer a call, you can schedule a time with our data team here or email us directly.
All datasets are delivered in downloadable CSV format. If you need it in a different format like JSON or Excel, we're happy to help—just let us know.
Yes! We support customized bundles, filtered data (by city, keyword, etc.), and multi-category combinations. Just contact us with your needs.

